Part of v2.5.0 · Chapter 4: Content & Growth
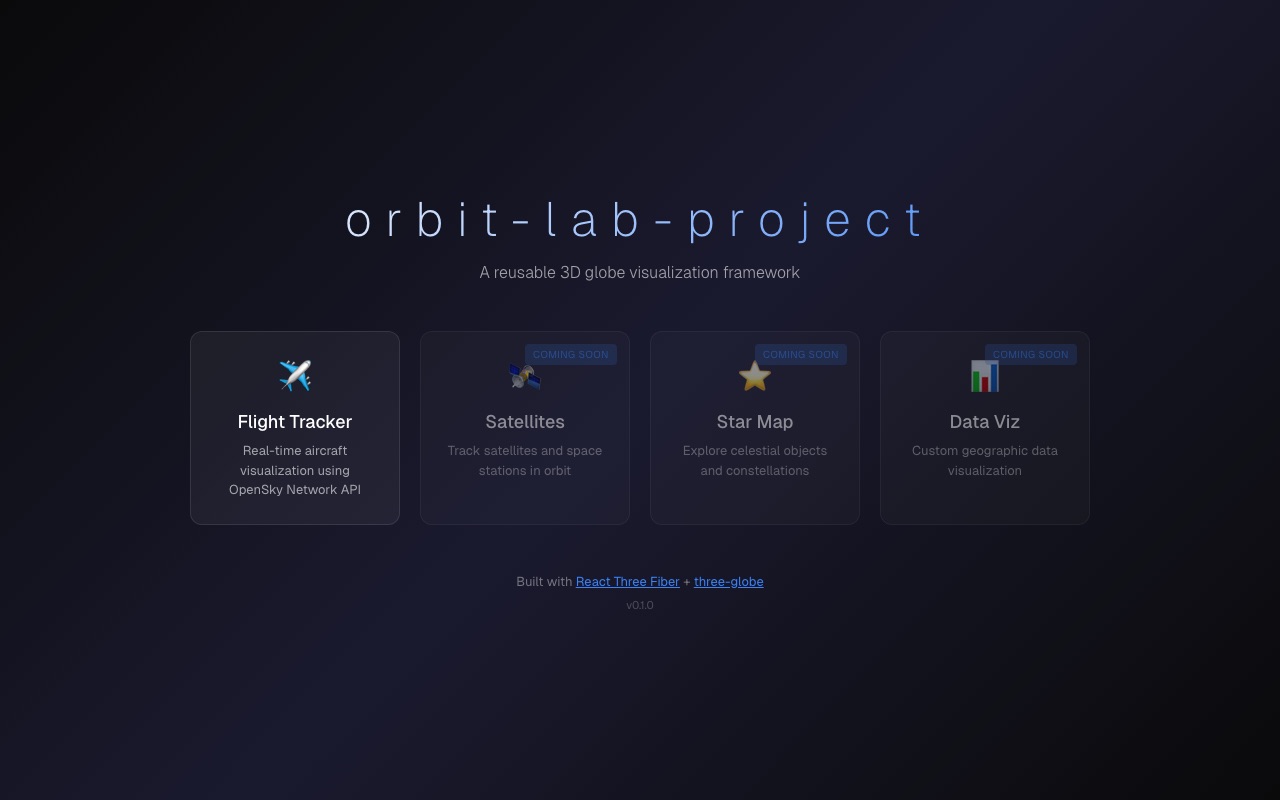
orbit-lab-project Portfolio CardBuilding orbit-lab-project: A 3D Flight Tracker
Creating a real-time 3D flight tracker was one of those projects that combined my passion for data visualization with my interest in aviation. In this post, I'll walk through the journey of building orbit-lab-project, from initial concept to working implementation.
![]()
The Vision
The goal was simple: create an interactive 3D globe showing real-time flight data. Users should be able to rotate the globe, zoom in on specific regions, and see flight paths animated in real-time.
Technical Stack
For this project, I chose:
- React for the UI framework
- Three.js for 3D rendering
- React Three Fiber as the React renderer for Three.js
- TypeScript for type safety
import { Canvas } from '@react-three/fiber';
import { OrbitControls, Stars } from '@react-three/drei';
function Scene() {
return (
<Canvas camera={{ position: [0, 0, 5] }}>
<ambientLight intensity={0.5} />
<pointLight position={[10, 10, 10]} />
<Earth />
<FlightPaths />
<OrbitControls enableZoom enablePan={false} />
<Stars radius={300} depth={60} count={1000} />
</Canvas>
);
}The Globe Component
The Earth component uses a textured sphere with a custom shader for the atmosphere effect:
function Earth() {
  const earthRef = useRef<THREE.Mesh>(null);
  const texture = useTexture('/textures/earth.jpg');

  useFrame(() => {
    if (earthRef.current) {
      earthRef.current.rotation.y += 0.001;
    }
  });

  return (
    <mesh ref={earthRef}>
      <sphereGeometry args={[1, 64, 64]} />
      <meshStandardMaterial map={texture} />
    </mesh>
  );
}
Flight Path Visualization
One of the trickier parts was calculating great circle paths between airports. Instead of straight lines, flights follow curved paths along the Earth's surface:
function calculateGreatCirclePath(
  start: [number, number],
  end: [number, number],
  segments: number = 100
): THREE.Vector3[] {
  const points: THREE.Vector3[] = [];

  for (let i = 0; i <= segments; i++) {
    const t = i / segments;
    const lat = start[0] + t * (end[0] - start[0]);
    const lon = start[1] + t * (end[1] - start[1]);

    const phi = (90 - lat) * (Math.PI / 180);
    const theta = (lon + 180) * (Math.PI / 180);

    const x = Math.sin(phi) * Math.cos(theta);
    const y = Math.cos(phi);
    const z = Math.sin(phi) * Math.sin(theta);

    points.push(new THREE.Vector3(x, y, z).multiplyScalar(1.02));
  }

  return points;
}
Performance Considerations
With hundreds of flights to render, performance became critical. Some optimizations I implemented:
- Instanced Meshes for aircraft markers
- Level of Detail (LOD) for flight paths based on zoom level
- Frustum Culling to skip rendering flights outside the view
Lessons Learned
Building this project taught me several valuable lessons:
- WebGL debugging requires patience and good tooling
- Three.js has a steep learning curve but powerful capabilities
- Real-time data visualization needs careful state management
- Performance profiling is essential for 3D web applications
What's Next
Future improvements I'm planning:
- Add airport information popups
- Implement flight search and filtering
- Add day/night cycle visualization
- Support for historical flight data replay
The orbit-lab-project continues to evolve, and I'm excited to keep pushing the boundaries of what's possible with 3D data visualization on the web.